
One of the ways to get a look inside what is happening in a tumor cell is to see what genes are turned on or off by analyzing the transcriptome. This technique uses next-generation sequencing to reveal the type and quantity of RNA – a molecular message transcribed from active DNA - in a biological sample.
Sequencing the RNA profile from a tissue sample means that the data will include sequences from a variety of different cell types. Several sophisticated computer methods have been developed to look at the data and predict what cell types, and how many, are represented. More recently, techniques that sequence the RNA from single cells have been developed. In cancer research, this can be used to compare malignant to non-malignant cells, for example, or to assess the variety of cells within a tumor microenvironment.
RNA sequencing of single cells is complicated by high costs and technical challenges, such as variable sensitivity (dropout), where some RNA sequences are missing, and gene expression variability that naturally exists with the same cell type. This limits its useful application in larger studies and translation to clinical applications.
A new cutting-edge tool
Using the knowledge of cell type-specific gene expression profiles obtained from single-cell RNA-sequencing data, a group led by Yongsoo Kim, an assistant professor in Cancer genomics/Bioinformatics at Amsterdam UMC, and Mark van der Wiel, a professor of Epidemiology and Data Science, have developed a new computer model that for the first time can efficiently account for the variability in gene expression within the same cell type to accurately analyze the cellular composition and transcriptome within a tissue sample.
Called BLADE (Bayesian Log-normAl DEconvolution), the model “incorporates a Bayesian method that jointly performs deconvolution and purification in a single-step [and] integrates two signatures of mean and variability of gene expression per-cell type using a log-normal probability model,” the authors report in the journal Nature Communications. The new model can accurately identify as many as 20 different cell types, which they demonstrated by evaluating over 700 simulated and real bulk gene expression data sets.
Carving up new possibilities
“BLADE opens up the possibility to molecularly characterize individual cell types in tissue based on the standard RNA-seq data,” the authors write. “For instance, we demonstrated that BLADE could be applied to estimate each cell type’s gene expression profiles that make up the tumor micro-environment. This allows us to characterize pathway activity in each immune cell type and possibly to recognize additional cell (sub-)types”, as well as identify clinically applicable biomarkers for immunotherapy.
Senior author Yongsoo Kim concludes: “BLADE is a powerful tool that can significantly contribute to unravel cellular heterogeneity in complex biological systems. The model significantly outperformed previously developed methods that relied on standard linear regression methods.”
Read the paper here: Andrade Barbosa, B., van Asten, S.D., Oh, J.W. et al. (2021) Bayesian log-normal deconvolution for enhanced in silico microdissection of bulk gene expression data. Nat. Commun. 12, 6106 (2021).
Also, BLADE python software is publicly available and maintained at Github.

For more information, contact Yongsoo Kim
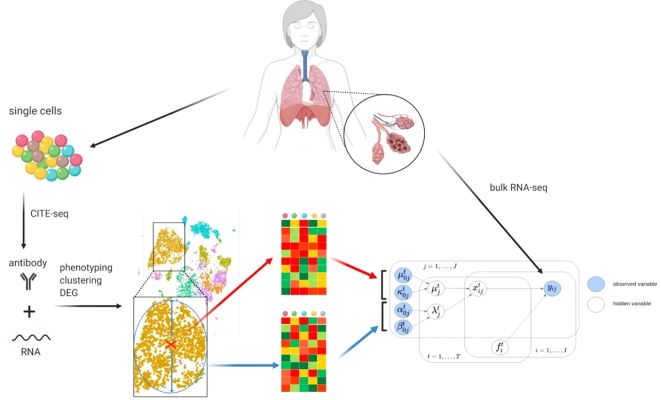
To construct a prior knowledge for BLADE, we used CITE-seq data that contains gene expression and cell surface marker profiles of each cell. Cells are then subject to phenotyping, clustering, and differential gene expression analysis. Then, for each cell type, we retrieved average expression profiles (red cross and top heat map) and standard deviation per gene as the variability (blue circle and bottom heatmap). This prior knowledge is then used in the hierarchical Bayesian model (bottom right) to deconvolute bulk transcriptome profiles. Source: : Andrade Barbosa, B., et al. (2021).
People involved affiliated with Amsterdam UMC: Bárbara Andrade Barbosa*, Saskia D. van Asten, Arantza Farina-Sarasqueta, Joanne Verheij, Frederike Dijk, Hanneke W. M. van Laarhoven, Bauke Ylstra, Juan J. Garcia Vallejo, Mark A. van de Wiel# , Yongsoo Kim#. *: first author, #: shared corresponding author.
Funding: this project was supported by Cancer Center Amsterdam Foundation.