As a result of the so-called area-based connectedness (ABC) analyses performed by the CWTS, the cloud-like figures below are created, carefully visualizing the estimated relevance of our research output to society.
Amsterdam Neuroscience key words
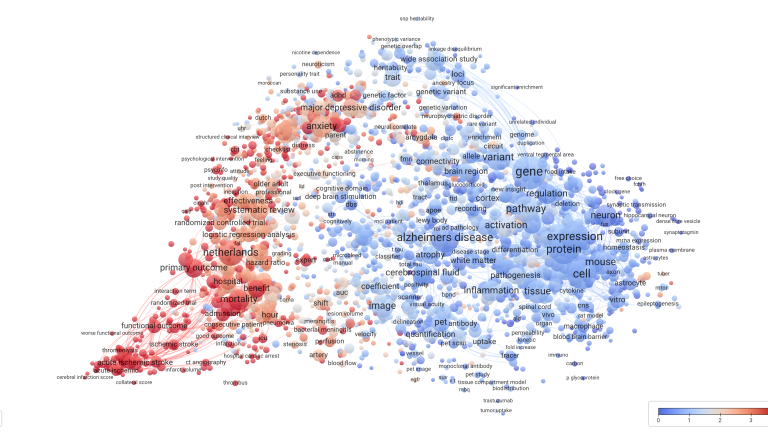
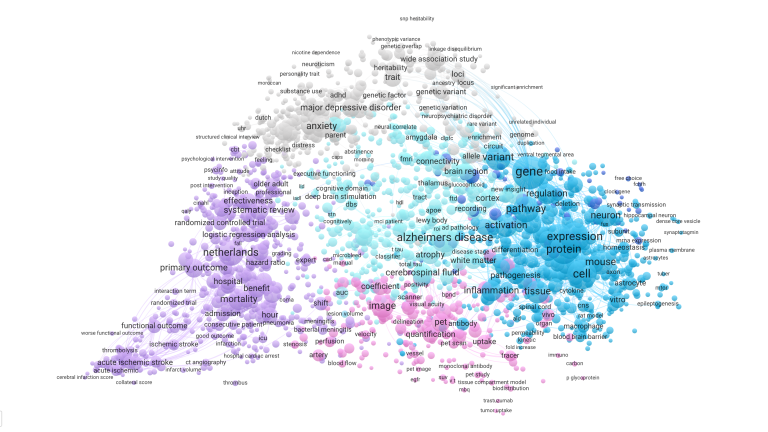
To generate the ABC analyses, the CWTS first created a so-called term map based on the key words most used in Amsterdam Neuroscience publications (see figure 1), that essentially shows the research landscape of Amsterdam Neuroscience. As seen in figure 1, different research areas within this landscape are indicated by six color groups, clustered by terms that relatively frequent co-exist in publications. For example, key words within the grey area like ‘anxiety’ and ‘major depressive disorder’ relatively more often occur together in publications. Apart from distinctive colors, different sizes of connected key words and spheres appear in figure 1. Larger key word spheres are detected more frequently in publications authored by Amsterdam Neuroscience researchers than smaller key word spheres. Overall, figure 1 indicates the most common research topics in publications of Amsterdam Neuroscience researchers.
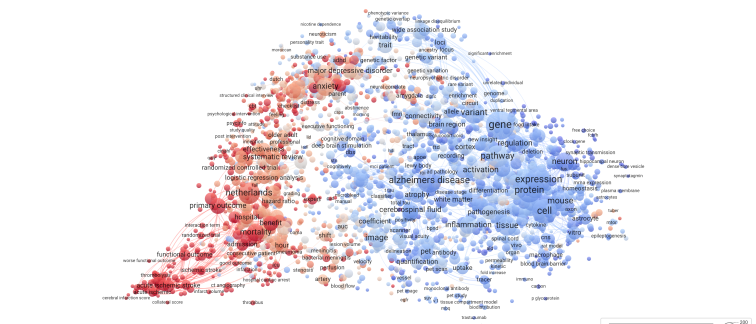
Using this key word map, the CWTS assessed how often the above-mentioned key words are being used in different societal areas to estimate the relation between the research performed at the institute and indicators of societal impact, see figure 2 and 3. In these figures, the static key words as shown in figure 1 are color-coded based on a heatmap that indicates the relative uptake of these terms in a) health policy (see figure 2), and b) clinical guidelines (see figure 3). Notice that in these figures the key words stay fixed, though the colors shift to indicate a more frequent use of a key word in societal impact documents or guidelines.
Amsterdam Neuroscience in relation to health(-care) policy
The heatmap-colors in figure 2 indicate the relative uptake of the terms in policy documents (red, higher frequency; blue, lower frequency). The color-coding is plotted compared to a reference database with a world-average of 1. The Amsterdam Neuroscience plot in figure 2 indicates that topics of publications in the field of psychiatry are more often incorporated in policy documents.
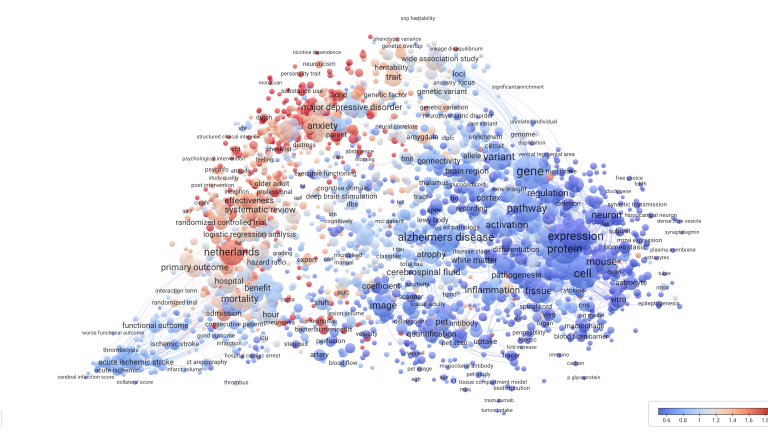
Amsterdam Neuroscience heatmap on clinical guidelines
The colors in figure 3 indicate the relative uptake of the terms in clinical guidelines (red, higher frequency; blue, lower frequency), again a reference database with a world-average of 1. A value higher than 1 means that a key word is more cited in a clinical guideline than average. Mainly the neurology and psychiatry programs of Amsterdam Neuroscience find their way into clinical guidelines relatively often, optimizing treatment procedures based on experience, expertise, and comprehensive research.